Monitoring systems play a critical role in ensuring the stability and performance of applications. In this guide, we will explore how to set up Grafana with Prometheus and Alertmanager using Docker, providing a robust solution for real-time monitoring and alerting. This setup is particularly useful for tracking system performance, resource utilization, and alerting on key metrics, making it essential for both developers and operations teams.
Prerequisites
Before diving into the setup, ensure you have the following prerequisites:
- Docker and Docker Compose installed on your system.
- Basic knowledge of Docker containers and networking.
- Access to a server or local environment for deployment.
- Understanding of monitoring concepts and Prometheus expressions.
Architecture Overview
Our monitoring stack will consist of the following components:
- Prometheus: An open-source monitoring system that scrapes metrics from various endpoints.
- Alertmanager: Manages alerts sent by Prometheus and handles notification routing.
- Grafana: A powerful visualization tool that integrates with Prometheus to display metrics on customizable dashboards.
- cAdvisor: Collects container metrics and exposes them to Prometheus.
The architecture will be encapsulated within Docker containers, enabling easy deployment and management.
Step 1: Setting Up Docker Environment
Start by creating a directory to hold your Docker configuration files:
mkdir grafana-monitoring
cd grafana-monitoring
Step 2: Create docker-compose.yml
version: '3.8'

services:
  prometheus:
    restart: always
    image: prom/prometheus:latest
    container_name: prometheus
    volumes:
      # Contains prometheus config.
      - /docker/volumes/prometheus/prometheus.yml:/etc/prometheus/prometheus.yml:ro
      # Contains alerts which will be picked up by prometheus ecosystem.
      - /docker/volumes/prometheus/alerts.yml:/etc/prometheus/alerts.yml:ro
    command:
      - '--config.file=/etc/prometheus/prometheus.yml'
      - '--web.enable-lifecycle' # To reload prometheus config externally.
    ports:
      - "9090:9090"
    networks:
      - monitoring
    depends_on:
      - alertmanager

  alertmanager:
    restart: always
    image: prom/alertmanager:latest
    container_name: alertmanager
    command:
      - '--config.file=/etc/alertmanager/alertmanager.yml'
    volumes:
      - /docker/volumes/prometheus/alertmanager.yml:/etc/alertmanager/alertmanager.yml:ro
    ports:
      - "9093:9093"
    networks:
      - monitoring

  node-exporter:
    restart: always
    image: prom/node-exporter:latest
    container_name: node-exporter
    ports:
      - "9100:9100"
    networks:
      - monitoring

  grafana:
    restart: always
    image: grafana/grafana:latest
    container_name: grafana
    ports:
      - 8086:3000
    networks:
      - monitoring
    environment:
      - GF_SECURITY_ADMIN_USER=${ADMIN_USER}
      - GF_SECURITY_ADMIN_PASSWORD=${ADMIN_PASSWORD} # Change this in production!
      # Below settings are for grafana to be able to send email alerts!.
      - GF_SMTP_ENABLED=true
      - GF_SMTP_HOST=smtp.gmail.com:587 # Your email smtp provider settings
      - GF_SMTP_USER=ds.pratap1997@gmail.com # SMTP user for email delivery
      - GF_SMTP_PASSWORD=${GF_SMTP_PASSWORD} # SMTP password can be get from AppProvider in Google
      - GF_SMTP_FROM_ADDRESS=ds.pratap1997@gmail.com # From
      - GF_SMTP_FROM_NAME=Grafana Alerts # Sender
    volumes:
      - /docker/volumes/grafana/provisioning/datasources:/etc/grafana/provisioning/datasources
      - /docker/volumes/grafana/grafana-data:/var/lib/grafana

  cadvisor:
    restart: always
    image: gcr.io/cadvisor/cadvisor:latest
    container_name: cadvisor
    volumes:
      - /:/rootfs:ro
      - /var/run:/var/run:rw
      - /sys:/sys:ro
      - /var/lib/docker/:/var/lib/docker:ro
    ports:
      - 9091:8080
    networks:
      - monitoring

networks:
  monitoring:
    driver: bridge

volumes:
  grafana-storage:
    driver: local
Explanation
- Prometheus: Scrapes metrics from the specified targets.
- Alertmanager: Receives alerts from Prometheus and manages notifications.
- Grafana: Provides a web interface for visualizing metrics.
- cAdvisor: Exposes container metrics for Prometheus to scrape.
Step 3: Configuring Prometheus
Create a configuration file for Prometheus at /docker/volumes/prometheus/prometheus.yml: as per the internal mapping in above docker-compose file.
global:
  scrape_interval: 15s

scrape_configs:
  - job_name: 'prometheus'
    static_configs:
      - targets: ['prometheus:9090']

  - job_name: 'node-exporter'
    static_configs:
      - targets: ['node-exporter:9100']

  - job_name: 'cadvisor'
    static_configs:
      - targets: ['cadvisor:9091']

alerting:
  alertmanagers:
    - static_configs:
        - targets: ['alertmanager:9093'] # to tell alertmanager about the alerts being fired.

rule_files:
  # TIP: Make sure the rules file is pointing to /etc/prometheus/alerts.yml inside the container or else the container will not pick up rules.
  - /etc/prometheus/alerts.yml
Prometheus Alerting Rules
Below rules are battle tested and can be used as is without mofification. Configure at /docker/volumes/prometheus/alerts.yml
groups:

- name: NodeExporterHost

  rules:

    - alert: HostOutOfMemory
      expr: '(node_memory_MemAvailable_bytes / node_memory_MemTotal_bytes * 100 < 10) * on(instance) group_left (nodename) node_uname_info{nodename=~".+"}'
      for: 2m
      labels:
        severity: warning
      annotations:
        summary: Host out of memory (instance )
        description: "Node memory is filling up (< 10% left)\n  VALUE = \n  LABELS = "

    - alert: HostMemoryUnderMemoryPressure
      expr: '(rate(node_vmstat_pgmajfault[1m]) > 1000) * on(instance) group_left (nodename) node_uname_info{nodename=~".+"}'
      for: 2m
      labels:
        severity: warning
      annotations:
        summary: Host memory under memory pressure (instance )
        description: "The node is under heavy memory pressure. High rate of major page faults\n  VALUE = \n  LABELS = "

    - alert: HostMemoryIsUnderutilized
      expr: '(100 - (avg_over_time(node_memory_MemAvailable_bytes[30m]) / node_memory_MemTotal_bytes * 100) < 20) * on(instance) group_left (nodename) node_uname_info{nodename=~".+"}'
      for: 1w
      labels:
        severity: info
      annotations:
        summary: Host Memory is underutilized (instance )
        description: "Node memory is < 20% for 1 week. Consider reducing memory space. (instance )\n  VALUE = \n  LABELS = "

    - alert: HostUnusualNetworkThroughputIn
      expr: '(sum by (instance) (rate(node_network_receive_bytes_total[2m])) / 1024 / 1024 > 100) * on(instance) group_left (nodename) node_uname_info{nodename=~".+"}'
      for: 5m
      labels:
        severity: warning
      annotations:
        summary: Host unusual network throughput in (instance )
        description: "Host network interfaces are probably receiving too much data (> 100 MB/s)\n  VALUE = \n  LABELS = "

    - alert: HostUnusualNetworkThroughputOut
      expr: '(sum by (instance) (rate(node_network_transmit_bytes_total[2m])) / 1024 / 1024 > 100) * on(instance) group_left (nodename) node_uname_info{nodename=~".+"}'
      for: 5m
      labels:
        severity: warning
      annotations:
        summary: Host unusual network throughput out (instance )
        description: "Host network interfaces are probably sending too much data (> 100 MB/s)\n  VALUE = \n  LABELS = "

    - alert: HostUnusualDiskReadRate
      expr: '(sum by (instance) (rate(node_disk_read_bytes_total[2m])) / 1024 / 1024 > 50) * on(instance) group_left (nodename) node_uname_info{nodename=~".+"}'
      for: 5m
      labels:
        severity: warning
      annotations:
        summary: Host unusual disk read rate (instance )
        description: "Disk is probably reading too much data (> 50 MB/s)\n  VALUE = \n  LABELS = "

    - alert: HostUnusualDiskWriteRate
      expr: '(sum by (instance) (rate(node_disk_written_bytes_total[2m])) / 1024 / 1024 > 50) * on(instance) group_left (nodename) node_uname_info{nodename=~".+"}'
      for: 2m
      labels:
        severity: warning
      annotations:
        summary: Host unusual disk write rate (instance )
        description: "Disk is probably writing too much data (> 50 MB/s)\n  VALUE = \n  LABELS = "

    - alert: HostOutOfDiskSpace
      expr: '((node_filesystem_avail_bytes * 100) / node_filesystem_size_bytes < 10 and ON (instance, device, mountpoint) node_filesystem_readonly == 0) * on(instance) group_left (nodename) node_uname_info{nodename=~".+"}'
      for: 2m
      labels:
        severity: warning
      annotations:
        summary: Host out of disk space (instance )
        description: "Disk is almost full (< 10% left)\n  VALUE = \n  LABELS = "

    - alert: HostDiskWillFillIn24Hours
      expr: '((node_filesystem_avail_bytes * 100) / node_filesystem_size_bytes < 10 and ON (instance, device, mountpoint) predict_linear(node_filesystem_avail_bytes{fstype!~"tmpfs"}[1h], 24 * 3600) < 0 and ON (instance, device, mountpoint) node_filesystem_readonly == 0) * on(instance) group_left (nodename) node_uname_info{nodename=~".+"}'
      for: 2m
      labels:
        severity: warning
      annotations:
        summary: Host disk will fill in 24 hours (instance )
        description: "Filesystem is predicted to run out of space within the next 24 hours at current write rate\n  VALUE = \n  LABELS = "

    - alert: HostOutOfInodes
      expr: '(node_filesystem_files_free{fstype!="msdosfs"} / node_filesystem_files{fstype!="msdosfs"} * 100 < 10 and ON (instance, device, mountpoint) node_filesystem_readonly == 0) * on(instance) group_left (nodename) node_uname_info{nodename=~".+"}'
      for: 2m
      labels:
        severity: warning
      annotations:
        summary: Host out of inodes (instance )
        description: "Disk is almost running out of available inodes (< 10% left)\n  VALUE = \n  LABELS = "

    - alert: HostFilesystemDeviceError
      expr: 'node_filesystem_device_error == 1'
      for: 2m
      labels:
        severity: critical
      annotations:
        summary: Host filesystem device error (instance )
        description: ": Device error with the  filesystem\n  VALUE = \n  LABELS = "

    - alert: HostInodesWillFillIn24Hours
      expr: '(node_filesystem_files_free{fstype!="msdosfs"} / node_filesystem_files{fstype!="msdosfs"} * 100 < 10 and predict_linear(node_filesystem_files_free{fstype!="msdosfs"}[1h], 24 * 3600) < 0 and ON (instance, device, mountpoint) node_filesystem_readonly{fstype!="msdosfs"} == 0) * on(instance) group_left (nodename) node_uname_info{nodename=~".+"}'
      for: 2m
      labels:
        severity: warning
      annotations:
        summary: Host inodes will fill in 24 hours (instance )
        description: "Filesystem is predicted to run out of inodes within the next 24 hours at current write rate\n  VALUE = \n  LABELS = "

    - alert: HostUnusualDiskReadLatency
      expr: '(rate(node_disk_read_time_seconds_total[1m]) / rate(node_disk_reads_completed_total[1m]) > 0.1 and rate(node_disk_reads_completed_total[1m]) > 0) * on(instance) group_left (nodename) node_uname_info{nodename=~".+"}'
      for: 2m
      labels:
        severity: warning
      annotations:
        summary: Host unusual disk read latency (instance )
        description: "Disk latency is growing (read operations > 100ms)\n  VALUE = \n  LABELS = "

    - alert: HostUnusualDiskWriteLatency
      expr: '(rate(node_disk_write_time_seconds_total[1m]) / rate(node_disk_writes_completed_total[1m]) > 0.1 and rate(node_disk_writes_completed_total[1m]) > 0) * on(instance) group_left (nodename) node_uname_info{nodename=~".+"}'
      for: 2m
      labels:
        severity: warning
      annotations:
        summary: Host unusual disk write latency (instance )
        description: "Disk latency is growing (write operations > 100ms)\n  VALUE = \n  LABELS = "

    - alert: HostHighCpuLoad
      expr: '(sum by (instance) (avg by (mode, instance) (rate(node_cpu_seconds_total{mode!="idle"}[2m]))) > 0.8) * on(instance) group_left (nodename) node_uname_info{nodename=~".+"}'
      for: 10m
      labels:
        severity: warning
      annotations:
        summary: Host high CPU load (instance )
        description: "CPU load is > 80%\n  VALUE = \n  LABELS = "

    - alert: HostCpuIsUnderutilized
      expr: '(100 - (rate(node_cpu_seconds_total{mode="idle"}[30m]) * 100) < 20) * on(instance) group_left (nodename) node_uname_info{nodename=~".+"}'
      for: 1w
      labels:
        severity: info
      annotations:
        summary: Host CPU is underutilized (instance )
        description: "CPU load is < 20% for 1 week. Consider reducing the number of CPUs.\n  VALUE = \n  LABELS = "

    - alert: HostCpuStealNoisyNeighbor
      expr: '(avg by(instance) (rate(node_cpu_seconds_total{mode="steal"}[5m])) * 100 > 10) * on(instance) group_left (nodename) node_uname_info{nodename=~".+"}'
      for: 0m
      labels:
        severity: warning
      annotations:
        summary: Host CPU steal noisy neighbor (instance )
        description: "CPU steal is > 10%. A noisy neighbor is killing VM performances or a spot instance may be out of credit.\n  VALUE = \n  LABELS = "

    - alert: HostCpuHighIowait
      expr: '(avg by (instance) (rate(node_cpu_seconds_total{mode="iowait"}[5m])) * 100 > 10) * on(instance) group_left (nodename) node_uname_info{nodename=~".+"}'
      for: 0m
      labels:
        severity: warning
      annotations:
        summary: Host CPU high iowait (instance )
        description: "CPU iowait > 10%. A high iowait means that you are disk or network bound.\n  VALUE = \n  LABELS = "

    - alert: HostUnusualDiskIo
      expr: '(rate(node_disk_io_time_seconds_total[1m]) > 0.5) * on(instance) group_left (nodename) node_uname_info{nodename=~".+"}'
      for: 5m
      labels:
        severity: warning
      annotations:
        summary: Host unusual disk IO (instance )
        description: "Time spent in IO is too high on . Check storage for issues.\n  VALUE = \n  LABELS = "

    - alert: HostContextSwitchingHigh
      expr: '(rate(node_context_switches_total[15m])/count without(mode,cpu) (node_cpu_seconds_total{mode="idle"}))/(rate(node_context_switches_total[1d])/count without(mode,cpu) (node_cpu_seconds_total{mode="idle"})) > 2'
      for: 0m
      labels:
        severity: warning
      annotations:
        summary: Host context switching high (instance )
        description: "Context switching is growing on the node (twice the daily average during the last 15m)\n  VALUE = \n  LABELS = "

    - alert: HostSwapIsFillingUp
      expr: '((1 - (node_memory_SwapFree_bytes / node_memory_SwapTotal_bytes)) * 100 > 80) * on(instance) group_left (nodename) node_uname_info{nodename=~".+"}'
      for: 2m
      labels:
        severity: warning
      annotations:
        summary: Host swap is filling up (instance )
        description: "Swap is filling up (>80%)\n  VALUE = \n  LABELS = "

    - alert: HostSystemdServiceCrashed
      expr: '(node_systemd_unit_state{state="failed"} == 1) * on(instance) group_left (nodename) node_uname_info{nodename=~".+"}'
      for: 0m
      labels:
        severity: warning
      annotations:
        summary: Host systemd service crashed (instance )
        description: "systemd service crashed\n  VALUE = \n  LABELS = "

    - alert: HostPhysicalComponentTooHot
      expr: '((node_hwmon_temp_celsius * ignoring(label) group_left(instance, job, node, sensor) node_hwmon_sensor_label{label!="tctl"} > 75)) * on(instance) group_left (nodename) node_uname_info{nodename=~".+"}'
      for: 5m
      labels:
        severity: warning
      annotations:
        summary: Host physical component too hot (instance )
        description: "Physical hardware component too hot\n  VALUE = \n  LABELS = "

    - alert: HostNodeOvertemperatureAlarm
      expr: '(node_hwmon_temp_crit_alarm_celsius == 1) * on(instance) group_left (nodename) node_uname_info{nodename=~".+"}'
      for: 0m
      labels:
        severity: critical
      annotations:
        summary: Host node overtemperature alarm (instance )
        description: "Physical node temperature alarm triggered\n  VALUE = \n  LABELS = "

    - alert: HostRaidArrayGotInactive
      expr: '(node_md_state{state="inactive"} > 0) * on(instance) group_left (nodename) node_uname_info{nodename=~".+"}'
      for: 0m
      labels:
        severity: critical
      annotations:
        summary: Host RAID array got inactive (instance )
        description: "RAID array  is in a degraded state due to one or more disk failures. The number of spare drives is insufficient to fix the issue automatically.\n  VALUE = \n  LABELS = "

    - alert: HostRaidDiskFailure
      expr: '(node_md_disks{state="failed"} > 0) * on(instance) group_left (nodename) node_uname_info{nodename=~".+"}'
      for: 2m
      labels:
        severity: warning
      annotations:
        summary: Host RAID disk failure (instance )
        description: "At least one device in RAID array on  failed. Array  needs attention and possibly a disk swap\n  VALUE = \n  LABELS = "

    - alert: HostKernelVersionDeviations
      expr: '(count(sum(label_replace(node_uname_info, "kernel", "$1", "release", "([0-9]+.[0-9]+.[0-9]+).*")) by (kernel)) > 1) * on(instance) group_left (nodename) node_uname_info{nodename=~".+"}'
      for: 6h
      labels:
        severity: warning
      annotations:
        summary: Host kernel version deviations (instance )
        description: "Different kernel versions are running\n  VALUE = \n  LABELS = "

    - alert: HostOomKillDetected
      expr: '(increase(node_vmstat_oom_kill[1m]) > 0) * on(instance) group_left (nodename) node_uname_info{nodename=~".+"}'
      for: 0m
      labels:
        severity: warning
      annotations:
        summary: Host OOM kill detected (instance )
        description: "OOM kill detected\n  VALUE = \n  LABELS = "

    - alert: HostEdacCorrectableErrorsDetected
      expr: '(increase(node_edac_correctable_errors_total[1m]) > 0) * on(instance) group_left (nodename) node_uname_info{nodename=~".+"}'
      for: 0m
      labels:
        severity: info
      annotations:
        summary: Host EDAC Correctable Errors detected (instance )
        description: "Host  has had  correctable memory errors reported by EDAC in the last 5 minutes.\n  VALUE = \n  LABELS = "

    - alert: HostEdacUncorrectableErrorsDetected
      expr: '(node_edac_uncorrectable_errors_total > 0) * on(instance) group_left (nodename) node_uname_info{nodename=~".+"}'
      for: 0m
      labels:
        severity: warning
      annotations:
        summary: Host EDAC Uncorrectable Errors detected (instance )
        description: "Host  has had  uncorrectable memory errors reported by EDAC in the last 5 minutes.\n  VALUE = \n  LABELS = "

    - alert: HostNetworkReceiveErrors
      expr: '(rate(node_network_receive_errs_total[2m]) / rate(node_network_receive_packets_total[2m]) > 0.01) * on(instance) group_left (nodename) node_uname_info{nodename=~".+"}'
      for: 2m
      labels:
        severity: warning
      annotations:
        summary: Host Network Receive Errors (instance )
        description: "Host  interface  has encountered  receive errors in the last two minutes.\n  VALUE = \n  LABELS = "

    - alert: HostNetworkTransmitErrors
      expr: '(rate(node_network_transmit_errs_total[2m]) / rate(node_network_transmit_packets_total[2m]) > 0.01) * on(instance) group_left (nodename) node_uname_info{nodename=~".+"}'
      for: 2m
      labels:
        severity: warning
      annotations:
        summary: Host Network Transmit Errors (instance )
        description: "Host  interface  has encountered  transmit errors in the last two minutes.\n  VALUE = \n  LABELS = "

    - alert: HostNetworkInterfaceSaturated
      expr: '((rate(node_network_receive_bytes_total{device!~"^tap.*|^vnet.*|^veth.*|^tun.*"}[1m]) + rate(node_network_transmit_bytes_total{device!~"^tap.*|^vnet.*|^veth.*|^tun.*"}[1m])) / node_network_speed_bytes{device!~"^tap.*|^vnet.*|^veth.*|^tun.*"} > 0.8 < 10000) * on(instance) group_left (nodename) node_uname_info{nodename=~".+"}'
      for: 1m
      labels:
        severity: warning
      annotations:
        summary: Host Network Interface Saturated (instance )
        description: "The network interface \"\" on \"\" is getting overloaded.\n  VALUE = \n  LABELS = "

    - alert: HostNetworkBondDegraded
      expr: '((node_bonding_active - node_bonding_slaves) != 0) * on(instance) group_left (nodename) node_uname_info{nodename=~".+"}'
      for: 2m
      labels:
        severity: warning
      annotations:
        summary: Host Network Bond Degraded (instance )
        description: "Bond \"\" degraded on \"\".\n  VALUE = \n  LABELS = "

    - alert: HostConntrackLimit
      expr: '(node_nf_conntrack_entries / node_nf_conntrack_entries_limit > 0.8) * on(instance) group_left (nodename) node_uname_info{nodename=~".+"}'
      for: 5m
      labels:
        severity: warning
      annotations:
        summary: Host conntrack limit (instance )
        description: "The number of conntrack is approaching limit\n  VALUE = \n  LABELS = "

    - alert: HostClockSkew
      expr: '((node_timex_offset_seconds > 0.05 and deriv(node_timex_offset_seconds[5m]) >= 0) or (node_timex_offset_seconds < -0.05 and deriv(node_timex_offset_seconds[5m]) <= 0)) * on(instance) group_left (nodename) node_uname_info{nodename=~".+"}'
      for: 10m
      labels:
        severity: warning
      annotations:
        summary: Host clock skew (instance )
        description: "Clock skew detected. Clock is out of sync. Ensure NTP is configured correctly on this host.\n  VALUE = \n  LABELS = "

    - alert: HostClockNotSynchronising
      expr: '(min_over_time(node_timex_sync_status[1m]) == 0 and node_timex_maxerror_seconds >= 16) * on(instance) group_left (nodename) node_uname_info{nodename=~".+"}'
      for: 2m
      labels:
        severity: warning
      annotations:
        summary: Host clock not synchronising (instance )
        description: "Clock not synchronising. Ensure NTP is configured on this host.\n  VALUE = \n  LABELS = "

    - alert: HostRequiresReboot
      expr: '(node_reboot_required > 0) * on(instance) group_left (nodename) node_uname_info{nodename=~".+"}'
      for: 4h
      labels:
        severity: info
      annotations:
        summary: Host requires reboot (instance )
        description: " requires a reboot.\n  VALUE = \n  LABELS = "


- name: GoogleCadvisor

  rules:

    - alert: ContainerKilled
      expr: 'time() - container_last_seen > 60'
      for: 0m
      labels:
        severity: warning
      annotations:
        summary: Container killed (instance )
        description: "A container has disappeared\n  VALUE = \n  LABELS = "

    - alert: ContainerAbsent
      expr: 'absent(container_last_seen)'
      for: 5m
      labels:
        severity: warning
      annotations:
        summary: Container absent (instance )
        description: "A container is absent for 5 min\n  VALUE = \n  LABELS = "

    - alert: ContainerHighCpuUtilization
      expr: '(sum(rate(container_cpu_usage_seconds_total{container!=""}[5m])) by (pod, container) / sum(container_spec_cpu_quota{container!=""}/container_spec_cpu_period{container!=""}) by (pod, container) * 100) > 80'
      for: 2m
      labels:
        severity: warning
      annotations:
        summary: Container High CPU utilization (instance )
        description: "Container CPU utilization is above 80%\n  VALUE = \n  LABELS = "

    - alert: ContainerHighMemoryUsage
      expr: '(sum(container_memory_working_set_bytes{name!=""}) BY (instance, name) / sum(container_spec_memory_limit_bytes > 0) BY (instance, name) * 100) > 80'
      for: 2m
      labels:
        severity: warning
      annotations:
        summary: Container High Memory usage (instance )
        description: "Container Memory usage is above 80%\n  VALUE = \n  LABELS = "

    - alert: ContainerVolumeUsage
      expr: '(1 - (sum(container_fs_inodes_free{name!=""}) BY (instance) / sum(container_fs_inodes_total) BY (instance))) * 100 > 80'
      for: 2m
      labels:
        severity: warning
      annotations:
        summary: Container Volume usage (instance )
        description: "Container Volume usage is above 80%\n  VALUE = \n  LABELS = "

    - alert: ContainerHighThrottleRate
      expr: 'sum(increase(container_cpu_cfs_throttled_periods_total{container!=""}[5m])) by (container, pod, namespace) / sum(increase(container_cpu_cfs_periods_total[5m])) by (container, pod, namespace) > ( 25 / 100 )'
      for: 5m
      labels:
        severity: warning
      annotations:
        summary: Container high throttle rate (instance )
        description: "Container is being throttled\n  VALUE = \n  LABELS = "

    - alert: ContainerLowCpuUtilization
      expr: '(sum(rate(container_cpu_usage_seconds_total{container!=""}[5m])) by (pod, container) / sum(container_spec_cpu_quota{container!=""}/container_spec_cpu_period{container!=""}) by (pod, container) * 100) < 20'
      for: 7d
      labels:
        severity: info
      annotations:
        summary: Container Low CPU utilization (instance )
        description: "Container CPU utilization is under 20% for 1 week. Consider reducing the allocated CPU.\n  VALUE = \n  LABELS = "

    - alert: ContainerLowMemoryUsage
      expr: '(sum(container_memory_working_set_bytes{name!=""}) BY (instance, name) / sum(container_spec_memory_limit_bytes > 0) BY (instance, name) * 100) < 20'
      for: 7d
      labels:
        severity: info
      annotations:
        summary: Container Low Memory usage (instance )
        description: "Container Memory usage is under 20% for 1 week. Consider reducing the allocated memory.\n  VALUE = \n  LABELS = "

- name: EmbeddedExporterPrometheus

  rules:

    - alert: PrometheusJobMissing
      expr: 'absent(up{job="prometheus"})'
      for: 0m
      labels:
        severity: warning
      annotations:
        summary: Prometheus job missing (instance )
        description: "A Prometheus job has disappeared\n  VALUE = \n  LABELS = "

    - alert: PrometheusTargetMissing
      expr: 'up == 0'
      for: 0m
      labels:
        severity: critical
      annotations:
        summary: Prometheus target missing (instance )
        description: "A Prometheus target has disappeared. An exporter might be crashed.\n  VALUE = \n  LABELS = "

    - alert: PrometheusAllTargetsMissing
      expr: 'sum by (job) (up) == 0'
      for: 0m
      labels:
        severity: critical
      annotations:
        summary: Prometheus all targets missing (instance )
        description: "A Prometheus job does not have living target anymore.\n  VALUE = \n  LABELS = "

    - alert: PrometheusTargetMissingWithWarmupTime
      expr: 'sum by (instance, job) ((up == 0) * on (instance) group_right(job) (node_time_seconds - node_boot_time_seconds > 600))'
      for: 0m
      labels:
        severity: critical
      annotations:
        summary: Prometheus target missing with warmup time (instance )
        description: "Allow a job time to start up (10 minutes) before alerting that it's down.\n  VALUE = \n  LABELS = "

    - alert: PrometheusConfigurationReloadFailure
      expr: 'prometheus_config_last_reload_successful != 1'
      for: 0m
      labels:
        severity: warning
      annotations:
        summary: Prometheus configuration reload failure (instance )
        description: "Prometheus configuration reload error\n  VALUE = \n  LABELS = "

    - alert: PrometheusTooManyRestarts
      expr: 'changes(process_start_time_seconds{job=~"prometheus|pushgateway|alertmanager"}[15m]) > 2'
      for: 0m
      labels:
        severity: warning
      annotations:
        summary: Prometheus too many restarts (instance )
        description: "Prometheus has restarted more than twice in the last 15 minutes. It might be crashlooping.\n  VALUE = \n  LABELS = "

    - alert: PrometheusAlertmanagerJobMissing
      expr: 'absent(up{job="alertmanager"})'
      for: 0m
      labels:
        severity: warning
      annotations:
        summary: Prometheus AlertManager job missing (instance )
        description: "A Prometheus AlertManager job has disappeared\n  VALUE = \n  LABELS = "

    - alert: PrometheusAlertmanagerConfigurationReloadFailure
      expr: 'alertmanager_config_last_reload_successful != 1'
      for: 0m
      labels:
        severity: warning
      annotations:
        summary: Prometheus AlertManager configuration reload failure (instance )
        description: "AlertManager configuration reload error\n  VALUE = \n  LABELS = "

    - alert: PrometheusAlertmanagerConfigNotSynced
      expr: 'count(count_values("config_hash", alertmanager_config_hash)) > 1'
      for: 0m
      labels:
        severity: warning
      annotations:
        summary: Prometheus AlertManager config not synced (instance )
        description: "Configurations of AlertManager cluster instances are out of sync\n  VALUE = \n  LABELS = "

    - alert: PrometheusAlertmanagerE2eDeadManSwitch
      expr: 'vector(1)'
      for: 0m
      labels:
        severity: critical
      annotations:
        summary: Prometheus AlertManager E2E dead man switch (instance )
        description: "Prometheus DeadManSwitch is an always-firing alert. It's used as an end-to-end test of Prometheus through the Alertmanager.\n  VALUE = \n  LABELS = "

    - alert: PrometheusNotConnectedToAlertmanager
      expr: 'prometheus_notifications_alertmanagers_discovered < 1'
      for: 0m
      labels:
        severity: critical
      annotations:
        summary: Prometheus not connected to alertmanager (instance )
        description: "Prometheus cannot connect the alertmanager\n  VALUE = \n  LABELS = "

    - alert: PrometheusRuleEvaluationFailures
      expr: 'increase(prometheus_rule_evaluation_failures_total[3m]) > 0'
      for: 0m
      labels:
        severity: critical
      annotations:
        summary: Prometheus rule evaluation failures (instance )
        description: "Prometheus encountered  rule evaluation failures, leading to potentially ignored alerts.\n  VALUE = \n  LABELS = "

    - alert: PrometheusTemplateTextExpansionFailures
      expr: 'increase(prometheus_template_text_expansion_failures_total[3m]) > 0'
      for: 0m
      labels:
        severity: critical
      annotations:
        summary: Prometheus template text expansion failures (instance )
        description: "Prometheus encountered  template text expansion failures\n  VALUE = \n  LABELS = "

    - alert: PrometheusRuleEvaluationSlow
      expr: 'prometheus_rule_group_last_duration_seconds > prometheus_rule_group_interval_seconds'
      for: 5m
      labels:
        severity: warning
      annotations:
        summary: Prometheus rule evaluation slow (instance )
        description: "Prometheus rule evaluation took more time than the scheduled interval. It indicates a slower storage backend access or too complex query.\n  VALUE = \n  LABELS = "

    - alert: PrometheusNotificationsBacklog
      expr: 'min_over_time(prometheus_notifications_queue_length[10m]) > 0'
      for: 0m
      labels:
        severity: warning
      annotations:
        summary: Prometheus notifications backlog (instance )
        description: "The Prometheus notification queue has not been empty for 10 minutes\n  VALUE = \n  LABELS = "

    - alert: PrometheusAlertmanagerNotificationFailing
      expr: 'rate(alertmanager_notifications_failed_total[1m]) > 0'
      for: 0m
      labels:
        severity: critical
      annotations:
        summary: Prometheus AlertManager notification failing (instance )
        description: "Alertmanager is failing sending notifications\n  VALUE = \n  LABELS = "

    - alert: PrometheusTargetEmpty
      expr: 'prometheus_sd_discovered_targets == 0'
      for: 0m
      labels:
        severity: critical
      annotations:
        summary: Prometheus target empty (instance )
        description: "Prometheus has no target in service discovery\n  VALUE = \n  LABELS = "

    - alert: PrometheusTargetScrapingSlow
      expr: 'prometheus_target_interval_length_seconds{quantile="0.9"} / on (interval, instance, job) prometheus_target_interval_length_seconds{quantile="0.5"} > 1.05'
      for: 5m
      labels:
        severity: warning
      annotations:
        summary: Prometheus target scraping slow (instance )
        description: "Prometheus is scraping exporters slowly since it exceeded the requested interval time. Your Prometheus server is under-provisioned.\n  VALUE = \n  LABELS = "

    - alert: PrometheusLargeScrape
      expr: 'increase(prometheus_target_scrapes_exceeded_sample_limit_total[10m]) > 10'
      for: 5m
      labels:
        severity: warning
      annotations:
        summary: Prometheus large scrape (instance )
        description: "Prometheus has many scrapes that exceed the sample limit\n  VALUE = \n  LABELS = "

    - alert: PrometheusTargetScrapeDuplicate
      expr: 'increase(prometheus_target_scrapes_sample_duplicate_timestamp_total[5m]) > 0'
      for: 0m
      labels:
        severity: warning
      annotations:
        summary: Prometheus target scrape duplicate (instance )
        description: "Prometheus has many samples rejected due to duplicate timestamps but different values\n  VALUE = \n  LABELS = "

    - alert: PrometheusTsdbCheckpointCreationFailures
      expr: 'increase(prometheus_tsdb_checkpoint_creations_failed_total[1m]) > 0'
      for: 0m
      labels:
        severity: critical
      annotations:
        summary: Prometheus TSDB checkpoint creation failures (instance )
        description: "Prometheus encountered  checkpoint creation failures\n  VALUE = \n  LABELS = "

    - alert: PrometheusTsdbCheckpointDeletionFailures
      expr: 'increase(prometheus_tsdb_checkpoint_deletions_failed_total[1m]) > 0'
      for: 0m
      labels:
        severity: critical
      annotations:
        summary: Prometheus TSDB checkpoint deletion failures (instance )
        description: "Prometheus encountered  checkpoint deletion failures\n  VALUE = \n  LABELS = "

    - alert: PrometheusTsdbCompactionsFailed
      expr: 'increase(prometheus_tsdb_compactions_failed_total[1m]) > 0'
      for: 0m
      labels:
        severity: critical
      annotations:
        summary: Prometheus TSDB compactions failed (instance )
        description: "Prometheus encountered  TSDB compactions failures\n  VALUE = \n  LABELS = "

    - alert: PrometheusTsdbHeadTruncationsFailed
      expr: 'increase(prometheus_tsdb_head_truncations_failed_total[1m]) > 0'
      for: 0m
      labels:
        severity: critical
      annotations:
        summary: Prometheus TSDB head truncations failed (instance )
        description: "Prometheus encountered  TSDB head truncation failures\n  VALUE = \n  LABELS = "

    - alert: PrometheusTsdbReloadFailures
      expr: 'increase(prometheus_tsdb_reloads_failures_total[1m]) > 0'
      for: 0m
      labels:
        severity: critical
      annotations:
        summary: Prometheus TSDB reload failures (instance )
        description: "Prometheus encountered  TSDB reload failures\n  VALUE = \n  LABELS = "

    - alert: PrometheusTsdbWalCorruptions
      expr: 'increase(prometheus_tsdb_wal_corruptions_total[1m]) > 0'
      for: 0m
      labels:
        severity: critical
      annotations:
        summary: Prometheus TSDB WAL corruptions (instance )
        description: "Prometheus encountered  TSDB WAL corruptions\n  VALUE = \n  LABELS = "

    - alert: PrometheusTsdbWalTruncationsFailed
      expr: 'increase(prometheus_tsdb_wal_truncations_failed_total[1m]) > 0'
      for: 0m
      labels:
        severity: critical
      annotations:
        summary: Prometheus TSDB WAL truncations failed (instance )
        description: "Prometheus encountered  TSDB WAL truncation failures\n  VALUE = \n  LABELS = "

    - alert: PrometheusTimeseriesCardinality
      expr: 'label_replace(count by(__name__) ({__name__=~".+"}), "name", "$1", "__name__", "(.+)") > 10000'
      for: 0m
      labels:
        severity: warning
      annotations:
        summary: Prometheus timeseries cardinality (instance )
        description: "The \"\" timeseries cardinality is getting very high: \n  VALUE = \n  LABELS = "

- name: EmbeddedExporterLoki

  rules:

    - alert: LokiProcessTooManyRestarts
      expr: 'changes(process_start_time_seconds{job=~".*loki.*"}[15m]) > 2'
      for: 0m
      labels:
        severity: warning
      annotations:
        summary: Loki process too many restarts (instance )
        description: "A loki process had too many restarts (target )\n  VALUE = \n  LABELS = "

    - alert: LokiRequestErrors
      expr: '100 * sum(rate(loki_request_duration_seconds_count{status_code=~"5.."}[1m])) by (namespace, job, route) / sum(rate(loki_request_duration_seconds_count[1m])) by (namespace, job, route) > 10'
      for: 15m
      labels:
        severity: critical
      annotations:
        summary: Loki request errors (instance )
        description: "The  and  are experiencing errors\n  VALUE = \n  LABELS = "

    - alert: LokiRequestPanic
      expr: 'sum(increase(loki_panic_total[10m])) by (namespace, job) > 0'
      for: 5m
      labels:
        severity: critical
      annotations:
        summary: Loki request panic (instance )
        description: "The  is experiencing % increase of panics\n  VALUE = \n  LABELS = "

    - alert: LokiRequestLatency
      expr: '(histogram_quantile(0.99, sum(rate(loki_request_duration_seconds_bucket{route!~"(?i).*tail.*"}[5m])) by (le)))  > 1'
      for: 5m
      labels:
        severity: critical
      annotations:
        summary: Loki request latency (instance )
        description: "The   is experiencing s 99th percentile latency\n  VALUE = \n  LABELS = "

- name: timezones
  rules:
    - record: european_summer_time_offset
      expr: |
          (vector(1) and (month() > 3 and month() < 10))
          or
          (vector(1) and (month() == 3 and (day_of_month() - day_of_week()) >= 25) and absent((day_of_month() >= 25) and (day_of_week() == 0)))
          or
          (vector(1) and (month() == 10 and (day_of_month() - day_of_week()) < 25) and absent((day_of_month() >= 25) and (day_of_week() == 0)))
          or
          (vector(1) and ((month() == 10 and hour() < 1) or (month() == 3 and hour() > 0)) and ((day_of_month() >= 25) and (day_of_week() == 0)))
          or
          vector(0)

    - record: europe_london_time
      expr: time() + 3600 * european_summer_time_offset
    - record: europe_paris_time
      expr: time() + 3600 * (1 + european_summer_time_offset)

    - record: europe_london_hour
      expr: hour(europe_london_time)
    - record: europe_paris_hour
      expr: hour(europe_paris_time)

    - record: europe_london_weekday
      expr: 0 < day_of_week(europe_london_time) < 6
    - record: europe_paris_weekday
      expr: 0 < day_of_week(europe_paris_time) < 6
    # opposite
    - record: not_europe_london_weekday
      expr: absent(europe_london_weekday)
    - record: not_europe_paris_weekday
      expr: absent(europe_paris_weekday)

    - record: europe_london_business_hours
      expr: 9 < europe_london_hour < 18
    - record: europe_paris_business_hours
      expr: 9 < europe_paris_hour < 18
    # opposite
    - record: not_europe_london_business_hours
      expr: absent(europe_london_business_hours)
    - record: not_europe_paris_business_hours
      expr: absent(europe_paris_business_hours)

    # new year's day / xmas / labor day / all saints' day / ...
    - record: europe_french_public_holidays
      expr: |
          (vector(1) and month(europe_paris_time) == 1 and day_of_month(europe_paris_time) == 1)
          or
          (vector(1) and month(europe_paris_time) == 12 and day_of_month(europe_paris_time) == 25)
          or
          (vector(1) and month(europe_paris_time) == 5 and day_of_month(europe_paris_time) == 1)
          or
          (vector(1) and month(europe_paris_time) == 11 and day_of_month(europe_paris_time) == 1)
          or
          vector(0)
    # opposite
    - record: not_europe_french_public_holidays
      expr: absent(europe_french_public_holidays)

- name: CPU Load
  rules:
    - alert: HighLoadQuietDuringWeekendAndNight
      expr: node_load5 > 10 and ON() (europe_london_weekday and europe_paris_weekday)

    - alert: HighLoadQuietDuringBackup
      expr: node_load5 > 10 and ON() absent(hour() == 2)

    - alert: HighLoad
      expr: |
          node_load5 > 20 and ON() (europe_london_weekday and europe_paris_weekday)
          or
          node_load5 > 10
Explanation
- Scrape Interval: The global scrape interval is set to 15 seconds.
- Job Configurations: Prometheus is set to scrape itself and cAdvisor.
- Alerting Rules: Contains alerts for CPU usage and a test alert to verify email notifications.
Step 4: Configuring Alertmanager
Create a configuration file for Alertmanager at /docker/volumes/prometheus/alertmanager.yml:
# alertmanager.yml

global:
  resolve_timeout: 5m

route:
  group_by: ['alertname']
  group_wait: 30s
  group_interval: 5m
  repeat_interval: 1h
  receiver: 'email'

receivers:
  - name: 'email'
    email_configs:
      # Below configuration is for alertmanager to be able to send emails whenever it intercepts any firing alerts from prometheus.
      - to: 'ds.pratap1997@gmail.com' # Email to
        from: 'ds.pratap1997@gmail.com' # Email Sender
        smarthost: 'smtp.gmail.com:587' # SMTP Provider settings
        auth_username: 'ds.pratap1997@gmail.com' # UserName with with alerts will be sent
        auth_identity: 'ds.pratap1997@gmail.com' # Email identity
        auth_password: '***********************' # Replace this with your app password
        require_tls: true #Ensure that email is sent over a secure conn.
        send_resolved: true # Send resolution alerts
Explanation
- Global Config: Sets the SMTP server details for email notifications.
- Route: Defines a default receiver for alerts.
- Receivers: Configures email notifications for alerts.
Step 5: Running the Stack
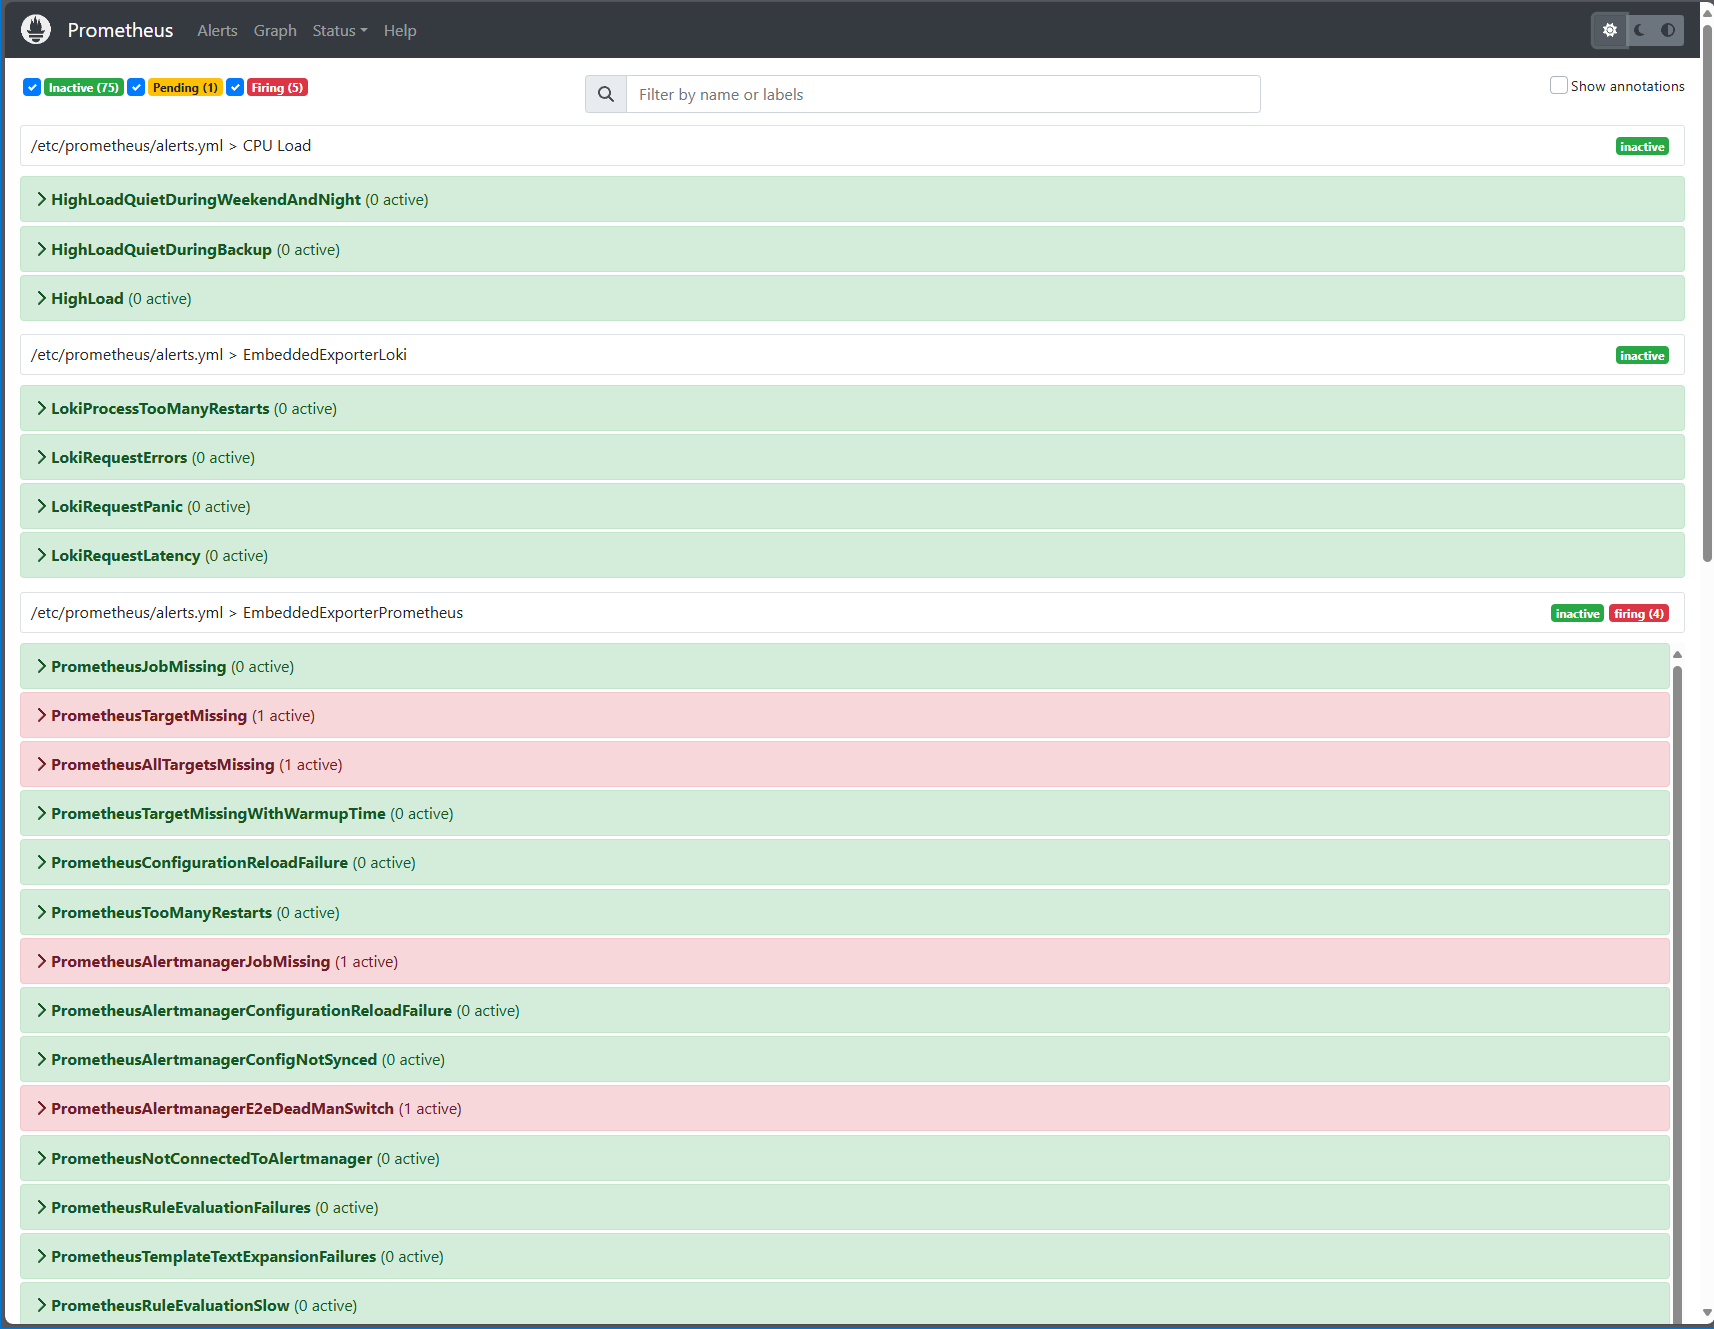
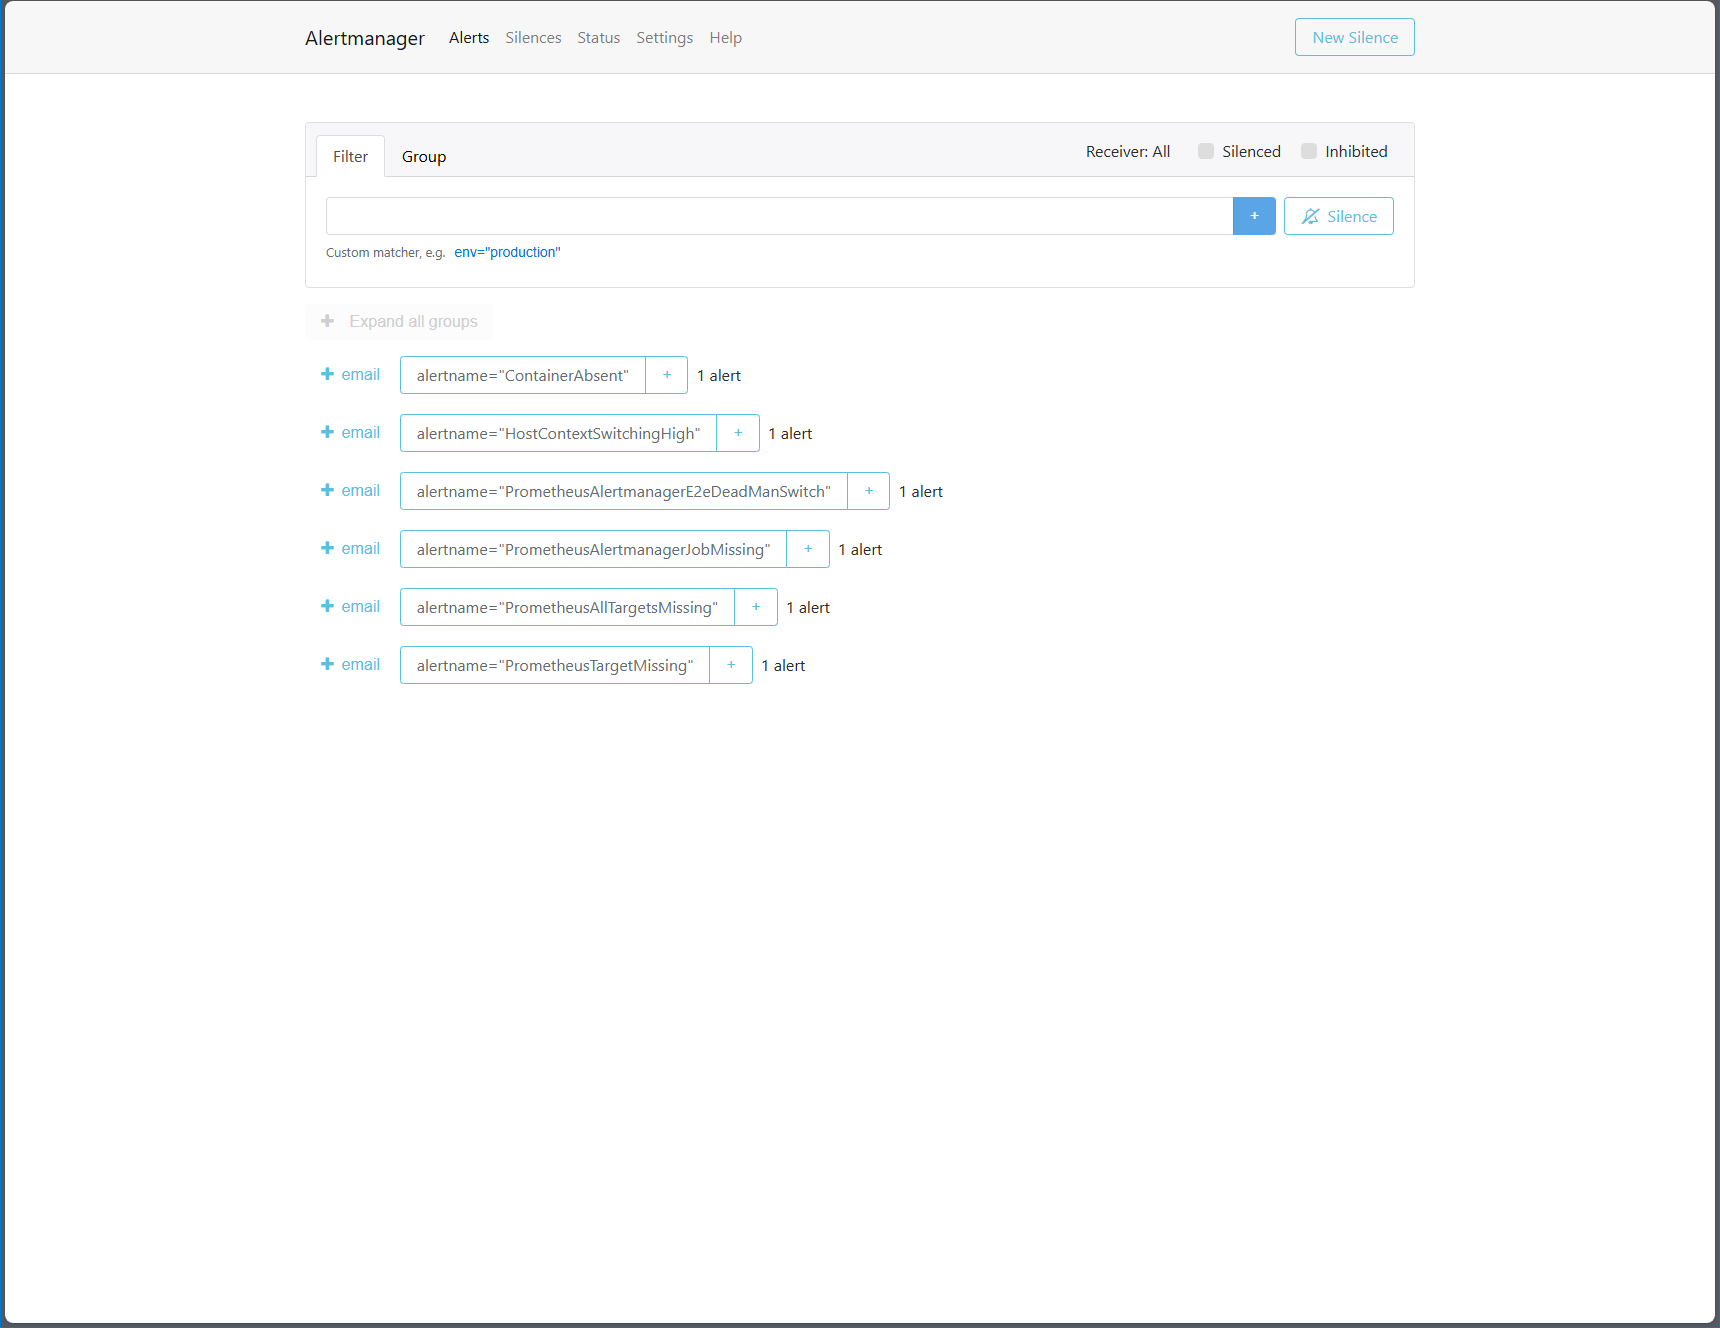
Prometheus Alerts
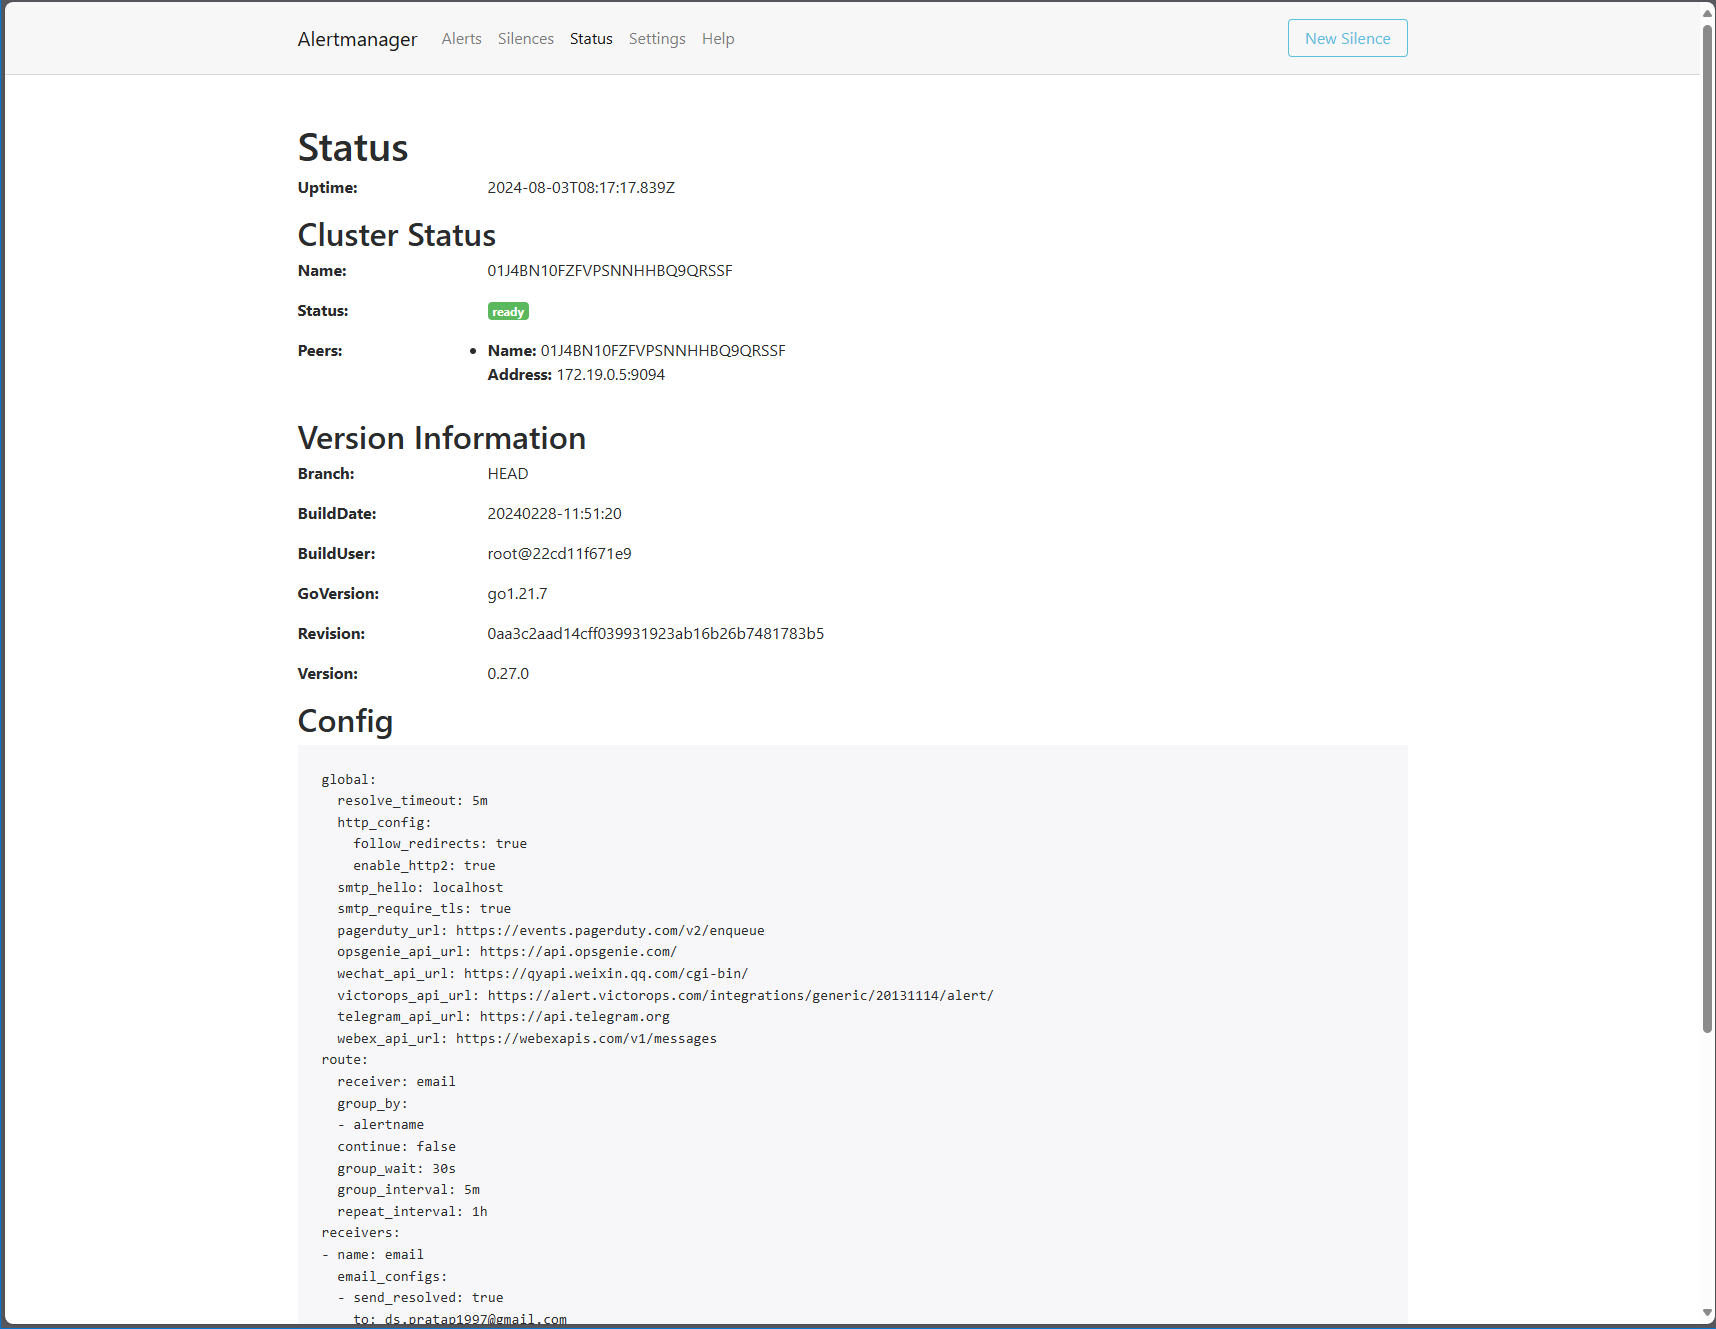
Alertmanager Status
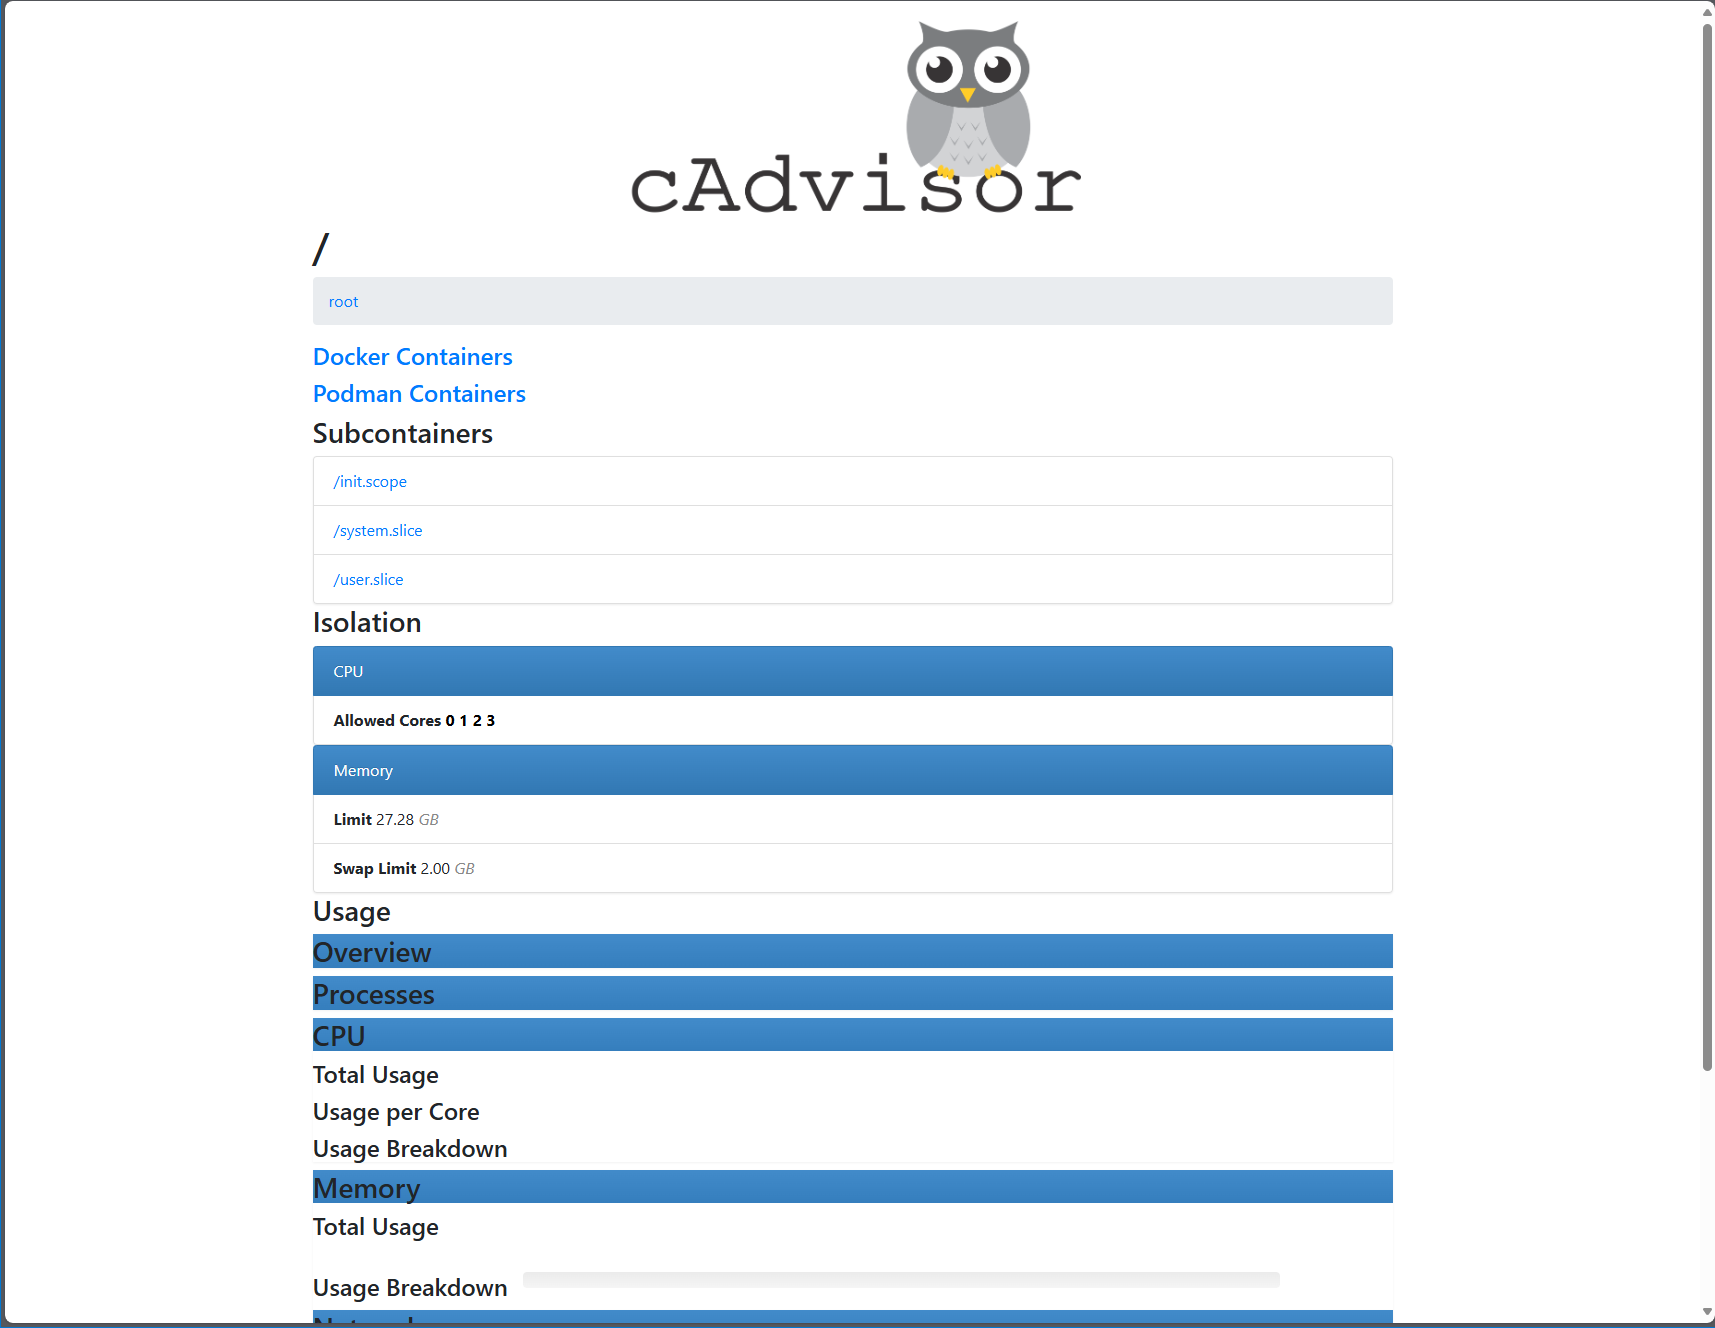
cAdvisor
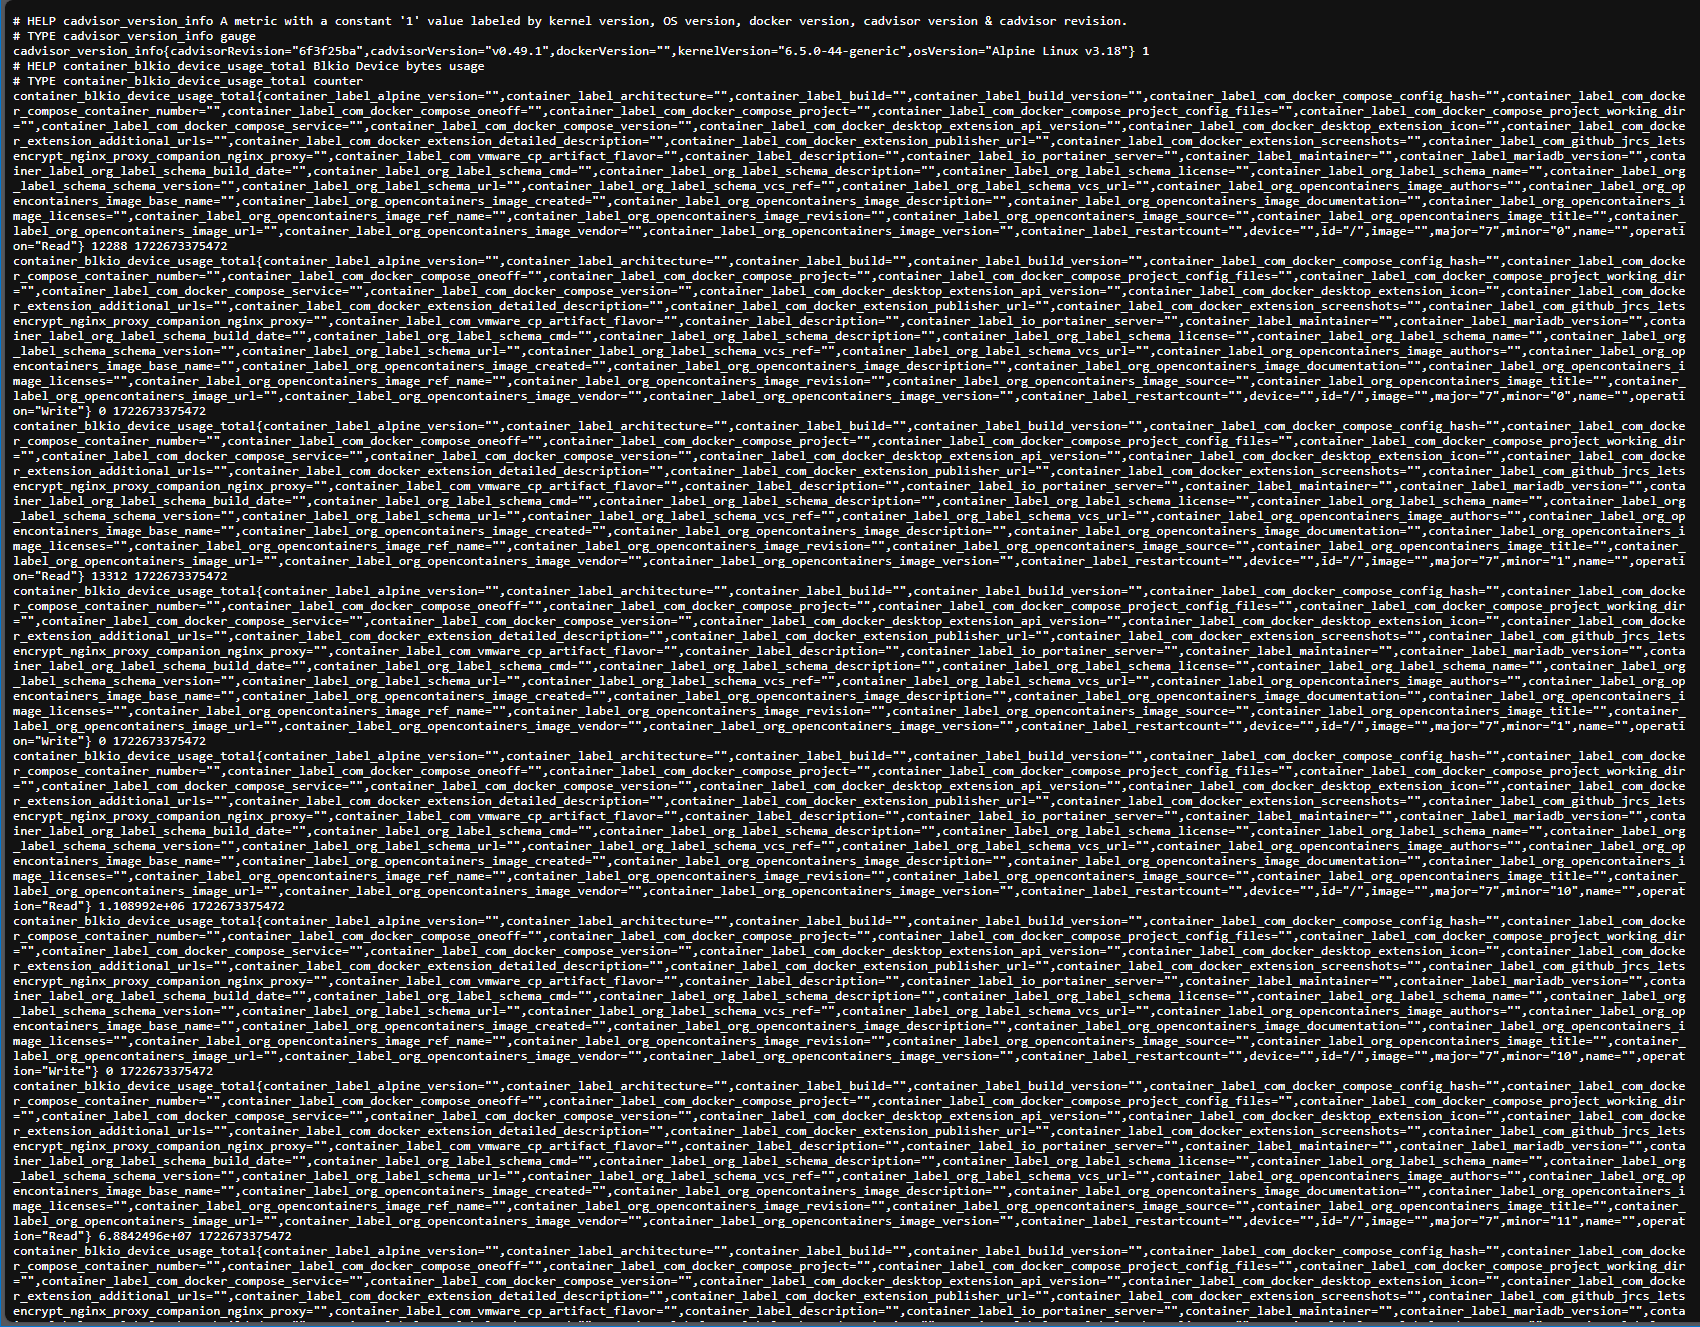
cAdvisor Metrics
 Launch the entire stack using docker compose.
docker-compose up -d
Verify if all containers are running.
docker ps
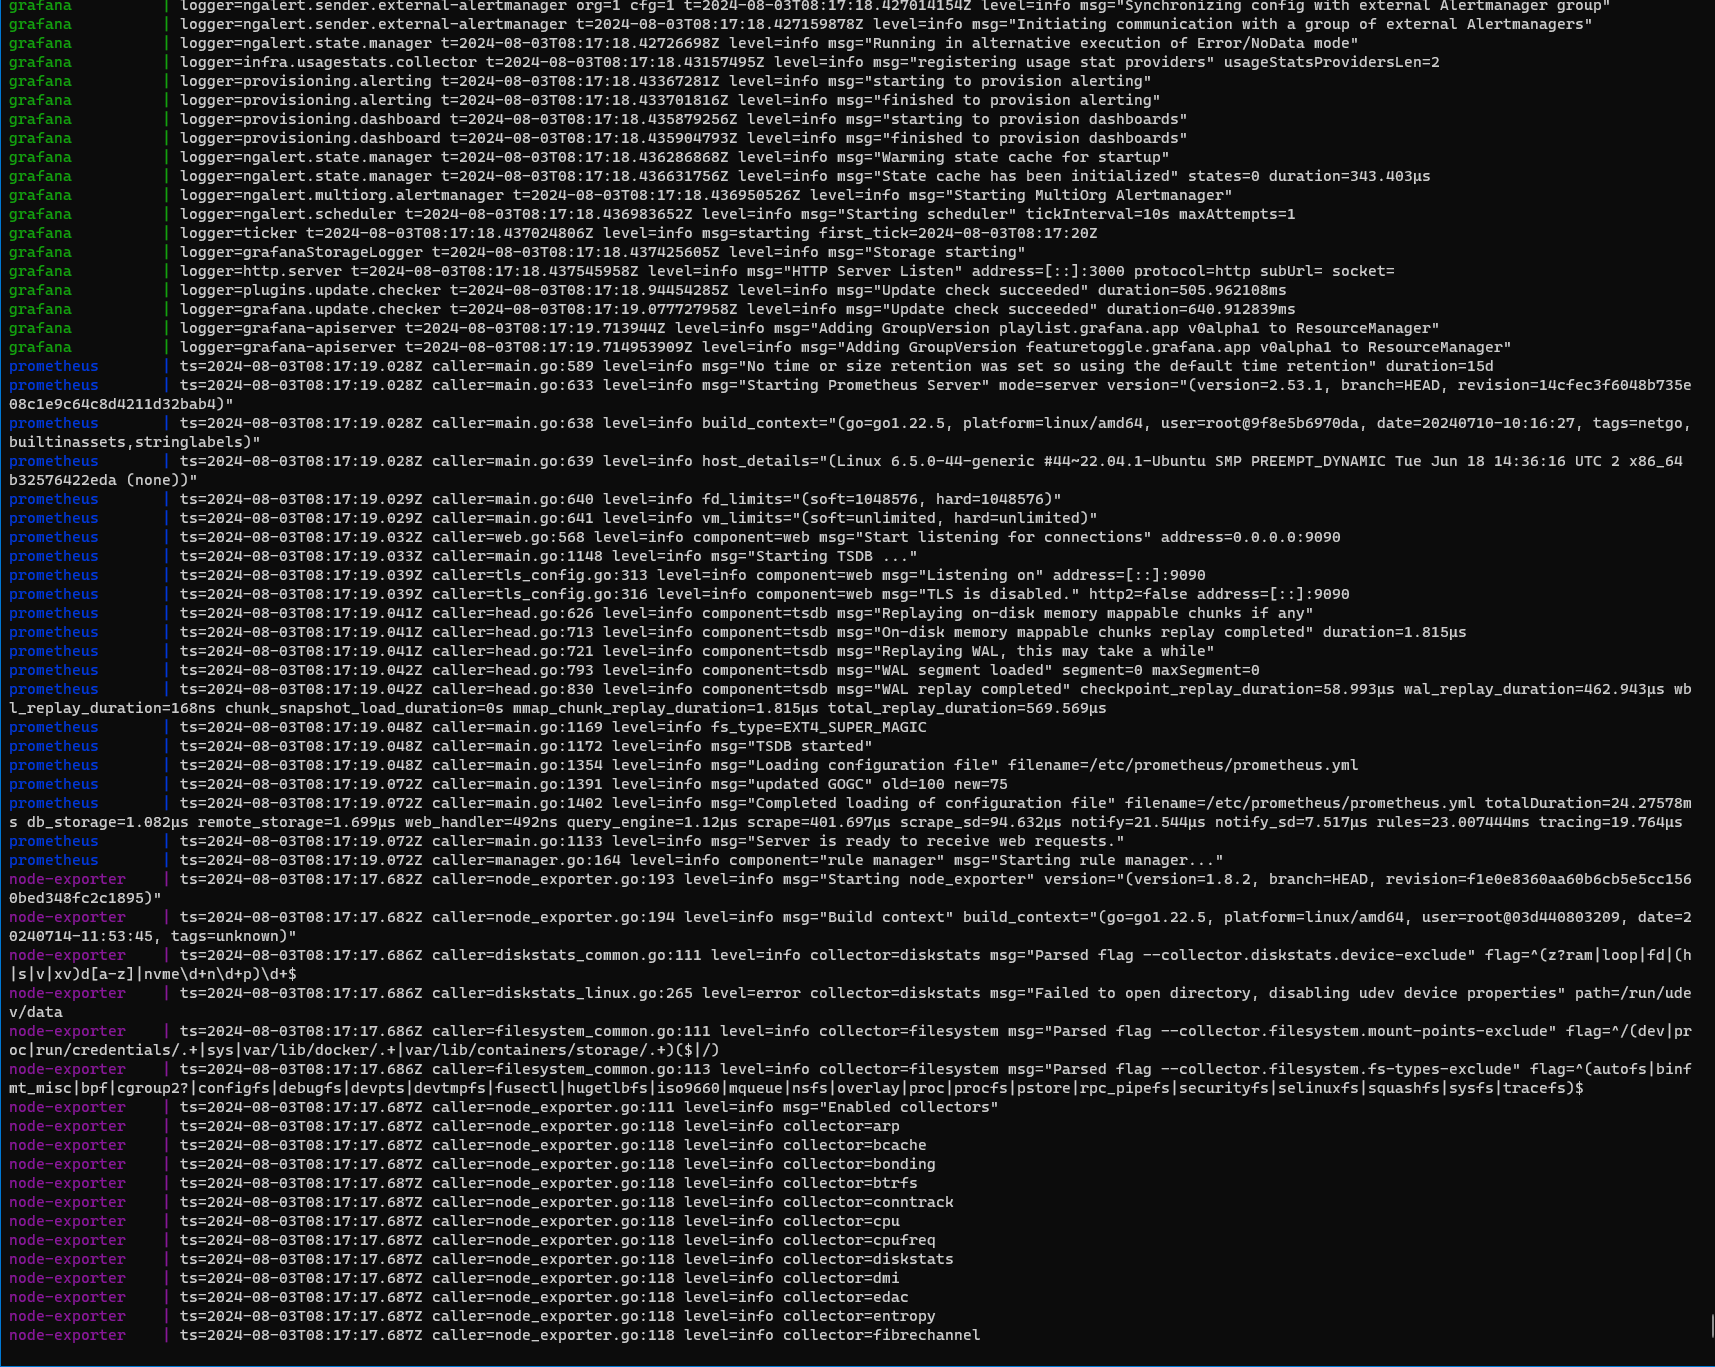
Check combined logs to see any potential issues or bottlenecks.
docker-compose logs -f
Combined Logs
Step 6: Accesssing Grafana
Open Grafana in your browser by navigating to http://localhost:3000. The default login credentials are:
- Username: admin
- Password: admin Upon the first login, you will be prompted to change the password.
TIP: Incase you are revisiting and you forgot the password.
Just hit forgot password you will recieve password reset instructions on email as we have already set email configuration in prometheus docker stack.
Adding Prometheus Data Source
- Click on “Configuration” in the Grafana sidebar.
- Select “Data Sources” and click “Add data source”.
- Choose Prometheus from the list.
- Enter http://prometheus:9090 as the URL.
- Click “Save & Test” to verify the connection.
Creating Dashboards
Grafana allows you to create custom dashboards to visualize your metrics. Here’s how to create a simple CPU usage dashboard:
- Click on “Create” in the sidebar and select “Dashboard”.
- Click “Add new panel”.
- Select Prometheus as the data source.
- Enter a query such as rate(node_cpu_seconds_total{mode!=”idle”}[5m]).
- Customize the visualization settings and click “Apply”.
Repeat these steps to add more panels for different metrics.
Step 7: Testing Alerts
To Test alerts notification, temporarily increase CPU usage threshlod in prometheus alerts.yml.
- alert: HighCPUUsage
  expr: 100 * (1 - avg by (instance) (rate(node_cpu_seconds_total{mode="idle"}[2m]))) > 10
  for: 2m
  labels:
    severity: warning
  annotations:
    summary: "High CPU Usage Detected"
    description: "Instance  has CPU usage greater than 10% for more than 2 minutes."
Alert Notifications

Reload prometheus configuration
Using docker command run
docker-compose exec prometheus kill -HUP 1
Using over http Run the below command on host machine.
curl -X POST http://localhost:9090/-/reload
Or if you are reloading remotely run below remember the replace host with your domain name where your prometheus server resides.
curl -X POST http://<host>:9090/-/reload
Check your email for alert notifications.
Troubleshooting Alerts
You can check your services if they are running fine using below commands.
docker-compose logs prometheus
docker-compose logs alertmanager
docker-compose logs cadvisor
docker-compose logs grafana
Common errors include:
- SMTP Configuration: Ensure SMTP details are correct in Alertmanager.
- Alert Expressions: Verify alert expressions in Prometheus.
- Networking: Check Docker networking settings and ensure containers can communicate.
Conclusion
By following these steps, you’ve successfully set up a monitoring stack with Grafana, Prometheus, and Alertmanager using Docker. This setup provides powerful insights into your system’s performance and the ability to receive real-time alerts for critical metrics.
Feel free to customize the configuration and extend the monitoring capabilities to suit your specific requirements. This monitoring stack forms the foundation for building more sophisticated observability solutions and integrating with other tools like Loki for log aggregation or Tempo for distributed tracing.
With this robust monitoring solution, you’re well-equipped to ensure the stability and performance of your applications, making it an essential part of your DevOps toolkit.
Feel free to connect with me on LinkedIn or email me at ds.pratap1997@gmail.com if you have any questions or suggestions.
Happy coding! 🎉